|
Glacial cycles
[2008-05-16]
animation: Lisa Roberts
Sydney 2008
dancers: Christine McMillan
and Lisa Roberts
data: Dominic Hodgson, British Antarctic Survey,
referred to: Wikipedia
Online accessed 2008-05-05

Milankovitch cycles data, Wikipedia
Past and future Milankovitch cycles.
VSOP allows prediction of past and future
orbital parameters with great accuracy.
ε is obliquity (axial tilt).
e is eccentricity.
ϖ is longitude of perihelion.
esin(ϖ) is the precession index,
which together with obliquity,
controls the seasonal cycle of insolation.
\overline{Q}^{\mathrm{day}} is
the calculated daily-averaged insolation
at the top of the atmosphere,
on the day of the summer solstice
at 65 N latitude.
Benthic forams and Vostok ice core
show two distinct proxies
for past global sealevel and temperature,
from ocean sediment and Antarctic ice respectively.
Vertical gray line is current conditions, at 2 ky A.D.

Cycles within cycles of change
(Roberts, Lisa and Wilson, 2008),
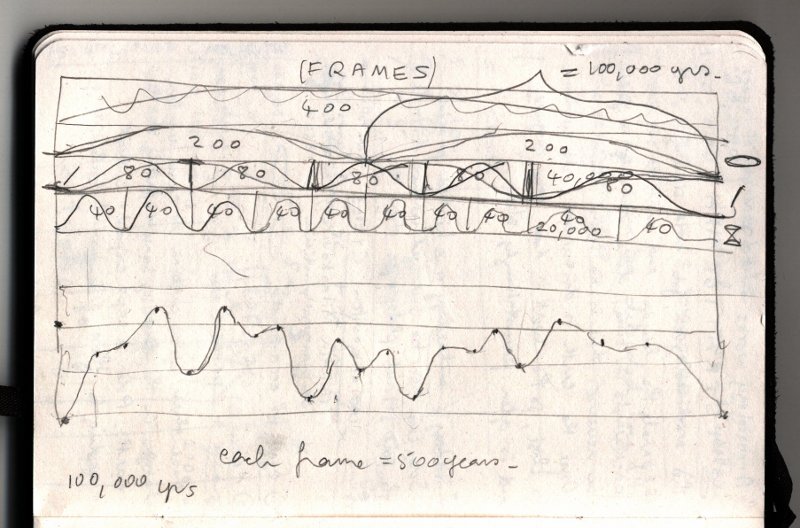
Plan for a 400 frame animation
representing Earth’s complex motion around the sun,
with each frame representing one year.
This is coming along nicely.
The final graph (glacial -interglacial cycles)
needs a label to appear with it,
as do the shaded columns marking the interglacials.
I am sure you are doing this anyway.
Amazing, isn't it,
that the inerglacials represent such short periods of time.
From these graphs one can really see
that Earth is mostly in a glacial state,
and that the interglacial in which we now live
is a relatively unusual event;
one that has allowed our civilisation to flourish.
I am glad you are seeing the beauty in the scientific data
- these are incredible graphs that explain so much
about the history of our planet
and its ability to support us.
Dominic Hodgson
Paleocologist/quaternary scientist
British Antarctic Survey
16 May 2008
| 