Thesis
Antarctic Animation

The animations have been presented at international art and science events: Arte en Antartida, Buenos Aires and Mexica (2008); the Third GLOBEC (Global Ocean Ecosystems Dynamics) Open Science Meeting, Victoria, Canada (June 2009); Polar Palooza, Australian Maritime Museum, Sydney (November 2009). All the animations are available online. For further details about how the animations were received, see Discussion/Impact of the animations.
Most of the animations that were made are discussed throughout the thesis in the context of the ideas that shaped them. 44 short animations were made that became a lexicon of primal gestural forms. The most resolved combinations of these forms can be seen in the two animations titled Insights and Energies.
Experiments were made in arranging the animations on various online interfaces, to allow for serendipitous connections to fragments of information. The aim was to reflect how knowledge of the environment accumulates as we move through it. Some of these experiments are described in Appendix 7.
Insights is the most abstract animation made with the simplest gestures and lines. It was designed to be easily read by the eye and held within body memory. Insights was made to encapsulate the key idea that emerged from the project, that the circle, spiral, and cross describe structures within the Antarctic ecosystemm and the forms that are most naturallt traced by human gestures.
A circle describes the clock-wise path of the circumpolar current, a spiral describes the motion of cold bottom water circulation, and a cross represents the one solid place around which Earth spins. Insights begins with a thick line that spirals outwards to form a circle.
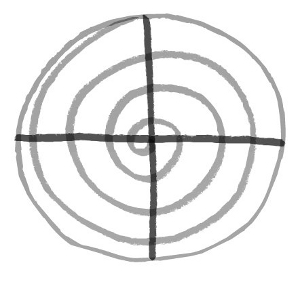
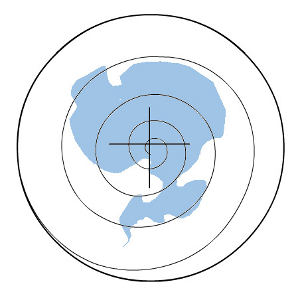
Lisa Roberts, Insights, Digital animation (2009)
Lines of similar thickness appear to draw themselves over the spiral to form a cross. As this image fades, fine lines repeat the spiraling and crossing choreography. Now, however, the cross radiates from the centre.
The first sequence simulates a drawing made by hand, the second by machine or instruments. Two ways of describing Antarctica are presented as gestural forms that can be easily remembered. The first appeals to body memories of drawing primal forms, or 'semantic primitives' (Fricker 2010) that are made spontaneously by Great Apes and children. The second appeals to body memories of composing and responding to technology (even remote sensors) to perceive and measure.
The second drawing appears with these words beneath it:
Antarctica is animated
Cold bottom water from sea ice spirals north ...
... drawn by the circumpolar current.
It replenishes life.
A cross marks a place ...
... to meet and reflect.
Over a human head with a rain shaped like Antarctica, the number 350 appears to draw itself. This number represents the parts per million of CO2 in the atmosphere that is promoted as safe for human life (350.org). The number is hand-drawn to appeal to body memories of drawing numbers, and to make it easy to hold in the mind. The number can be remembered as a gesture and an image. The primal gestures add depths of meaning to the scientific information.
(Imagine drawing '350' over the image below.)
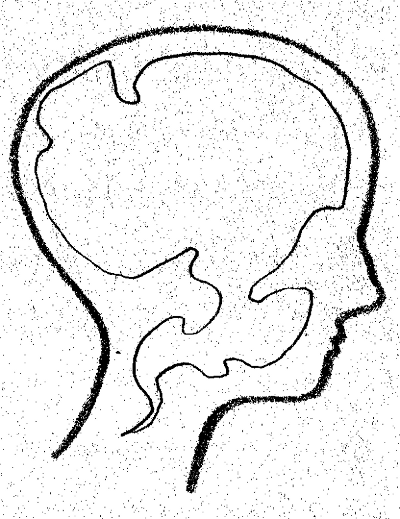

Lisa Roberts, 350, Digital animation (2009)
Veteran Australian Antarctic scientist, Bill Burch, commented in the log (2009),
Loved the idea of putting the Antarctic 'tadpole' as a brain inside the head. Then animating the 350, representing a realisable goal of 350 parts per million of carbon dioxide (we're currently sitting at 384 I think). Setting goals in terms of measurable qualities makes for a better focus for action.
The 350 logo slowly fades, leaving only the head with the Antarctic brain, and the words, 'Antarctica is melting'. But is it?
Another veteral Australian Antarctic scientist questions. Owen Holmwood Says (log entry 26 October 2009):
Lisa, your graphic is great, but is the ice really melting in Antarctica? Rupert Murdoch's media says no, others say yes. Who knows?
A line of thought pressed recently by The Australian neswpaper is that climate change scientists have no concensus on global warming (Gordon Crovitz, 2010). However, my understanding, from attending to scientists, is that our massive burning of fossil fuel has upset the natural cycles of climate change and that it is impossible to accurately predict the consequences of our actions. Antarctica is both freezing and melting (David Carter, in con. 2010). My understanding is that rising temperatures are raising humidity which increases snow fall on Antarctica's ice cap, and also increases the number of icebergs that are calving from its edges. Like the freezing and thawing of sea ice and glacial ice, processes of change in Antarctica are complex. They are still not fully understood.
Further responses to this and other animations can be read in Conclusion/Impact of the animations.
Energies is the longest (10 mins 30 secs) and most developed animation to evolve from the project. The animation was made at the suggestion of marine biologist, Jaime Gomez-Gutierrez, to screen at the Third GLOBEC Open Science Meeting (June 1009).
Gomez-Gutierrez had been shown the animations, How do krill grow and Krill watching, by fellow scientists, Steve Nicol and So Kawaguchi. They had suggested these animations be screened at the conference to add interest to their presentations of krill research. Gomez-Gutierrez invited me to prepare more animations to accompany these.
Energies was inspired by seeing the birth of a krill, hearing the insights of scientists who breed them, and drawing krill from life. Because krill are central to the food web through which all Antarctic life forms connect, it made sense for krill to be a central focus. The circular form of a krill egg resembles the structure of Antarctica and the world. The circle symbolises wholeness and connectivity.
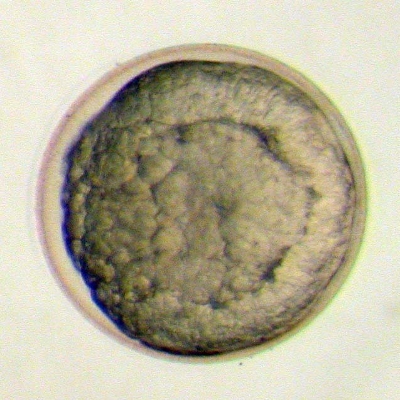
Video capture of krill egg, Courtesy Gomez-Gutierrez, 2002
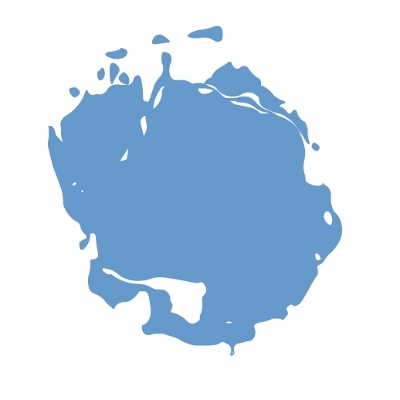
Lisa Roberts, Energies: Turning cycle, Digital animation (2009)
Nicol's argument that biologists can more easily observe connections between animals and their terrestrial environments, to obtain a 'big picture' overview (Nicol, 2003, p.199), challenged me to visualise the Antarctic environment that is invisible to most people.
When Gomez-Gutierrez shared his insights about parasites of krill, I was further intrigued by the forces that shape Antarctica that are beyond human perception (Gomez-Gutierrez, 2009):
It is amazing how there are small worlds of organisms inside and on the surface of such small animals, even parasites of parasites, can you believe it?
His editorial assistance with the notes I wrote to accompany the animation at the conference confirmed my understanding of his view that Antarctica is shaped through interactions between minute biological forms and immense physical systems of energy (Appendix 2).
Energies represents physical and biological forces that interact to shape Antarctica. The shorter animations served as a lexicon of gestural forms that could be combined to represent connections between diatoms, krill, sea butterflies (pteropods), seals, humans, sea ice, bottom water circulation, the circumpolar current, ice melting, and sea levels rising. Krill became a focal point for combining gestures and lines to represent a whole interconnected system. A central visual focus was maintained in the screen space to reinforce the idea of unity.
Energies begins in silence with a melting, overturning iceberg. The iceberg was used as a symbol for change and transformation.
The iceberg was used to symbolise change and transformation.
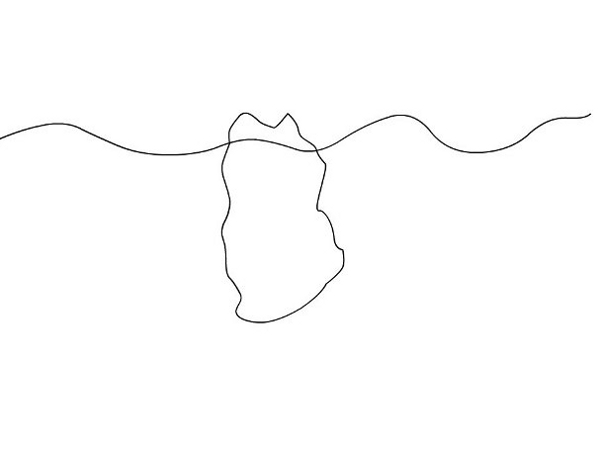
Lisa Roberts, Energies: Berglife, Digital animation (2009)
As the ice berg melts, your eye is led from the vastness of the ocean to a tiny krill emerging from its egg.
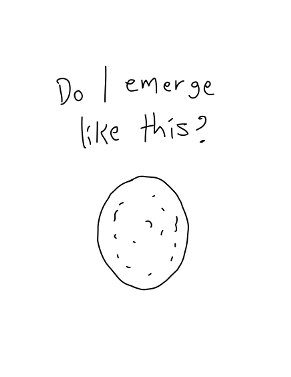
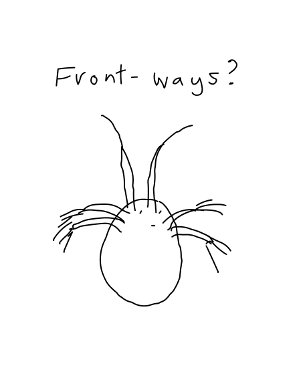
Lisa Roberts, Energies: How do krill grow?, Digital animation (2009)
The melting ice berg completes a transformation; the birth of a krill begins another. Words from the email messages between me and the scientist, So Kawaguchi, are written beside animated diagrams of normal krill development. They are written like speech bubbles to suggest the voices of the scientist and the krill. Piano music improvised by an 11 year-old girl, Sophie Green, conveys a feeling of childhood wonder.
The representation of krill now changes from 'talking' data sets to drawings made from life. Contour drawn lines describe the energetic motion paths of live adult krill, reflected in their curvaceous structures. One krill appears to draw itself with the lines that were made from direct observation.
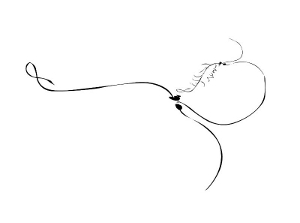
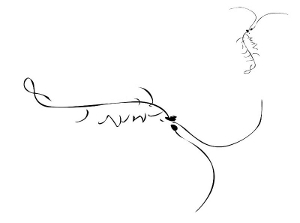
Lisa Roberts, Energies: Krill watching, Digital animation (2009)
Drawings were traced from the Australian Antarctic Division's Krill cam (Antdiv, 2010). Krill dance across the screen from corner to corner to describe crosses. Krill cross the centre of the screen to maintain the central focus established at the start.

Lisa Roberts, Energies, Digital animation
Tiny particles are shown as if drawn up by the motion of water, caused by many krill swimming together to the surface. The particles represent krill and diatoms. Their clockwise motion echoes the westerly winds around Antarctica.
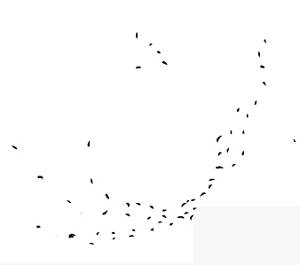
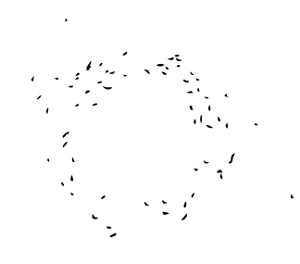
Lisa Roberts, Energies, Digital animation (2009)

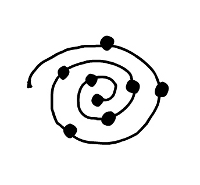
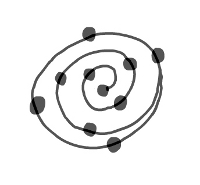
Lisa Roberts, Energies, Digital animation (2009)
The sound of the shakuhachi (Japanese flute) evokes the solitude of inland Antarctica. This music was contributed by scientist, Rupert Summerson, who worked there for many months at a time with the British Antarctic Survey (BAS).
Diatoms (a form of phytoplankton) appear as breathing froms, changing their patterns to a cyclic rhythm. The diatom's gesture refers to our connection to these invisible forms through breath:
Take one deep breath, pause ... breathe out and another in, pause and contemplate that the last breath was a life-giving gift from organisms many of us have never heard of. Phytoplankton, those tiny plants floating around in the vast openness of the oceans, tirelessly working and giving their lives so that we humans and every other animal on earth can breathe comfortably (van der Merwe and Lannuzel, 2010).
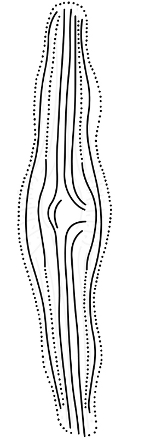
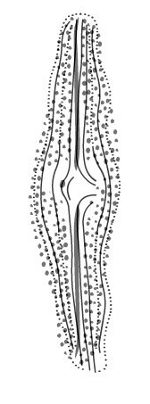
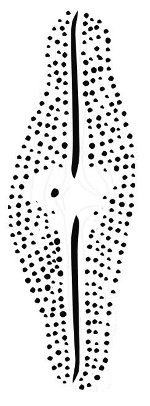
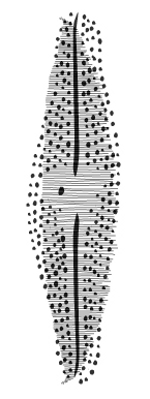
Lisa Roberts, Energies: Diatoms, Digital animation (2009)
Antarctica appears to breathe as its sea ice freezes and melts. The movement patterns of satellite images and CO2 molecules were synchronised with human breath.
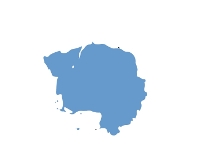
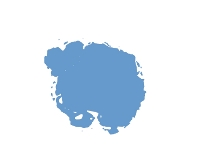
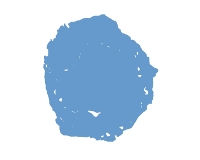
Lisa Roberts, Energies: Sea ice, Digital animation (2009)
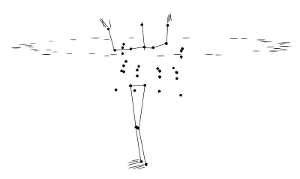
Human forms dance to imagined flows of energy through water. Dots that mark the joints of a human form accumulate and disperse like molecules of water. A mirroring dance of dots represents self-reflection. Deep sounds (Jon Hizzard, 2003) evoke the unknown depths of the ocean.
The movement patterns of CO2 molecules and satellite images were synchronised with human breath. Human forms dance to imagined flows of energy through water. Dots that mark the joints of a human form accumulate and disperse like molecules of water. A mirroring dance of dots represents self-reflection. Deep sounds evoke the unknown depths of the ocean. [footnote: Artist Jon Hizzard contributed music he had composed that combined sound recordings made in Antarctica with sounds recorded on Flinders Island, Tasmania (2003)]
Water molecules perform a cyclic dance of freezing and melting. Their symmetry resembles reflections in mirrors of water and ice. Perfect symmetry reflects the ideal of Antarctica as pristine. Sea ice freezing and melting circulates nutrient-rich bottom water through the Southern Ocean.
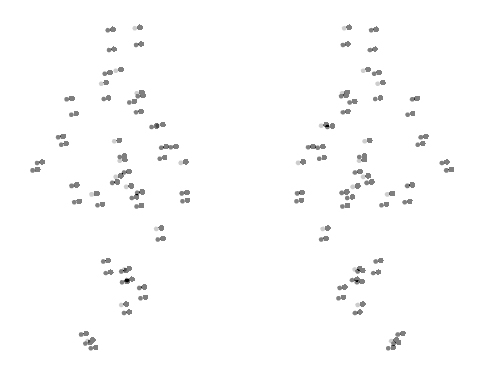
Lisa Roberts, Energies: Water energy, Digital animation (2009)
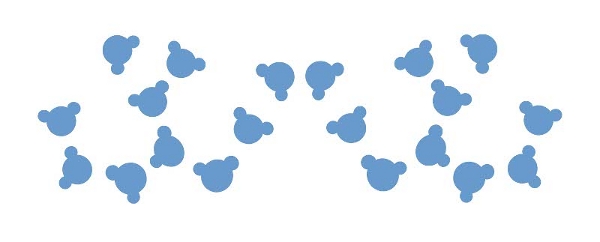
Lisa Roberts, Energies: Water energy, Digital animation (2009)
At the centre of a massive circle (the circumpolar current), a human form spirals. This figure presents as a powerhouse of energy and replenisher of new life.
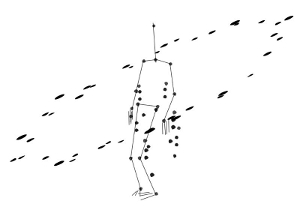
Lisa Roberts, Energies: Bottom water circulation, Digital animation (2009
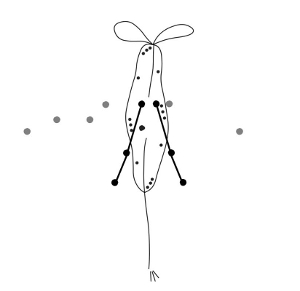
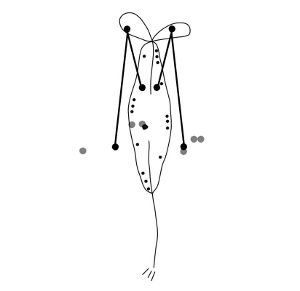
Lisa Roberts, Energies: Diatoms, Digital animation (2009
The Antarctic convergence is a circling field of energy where nutrients are drawn up towards the ocean surface. A perpetually dynamic field of energy, the Antarctic convergence draws predators and prey together into a battle for survival.
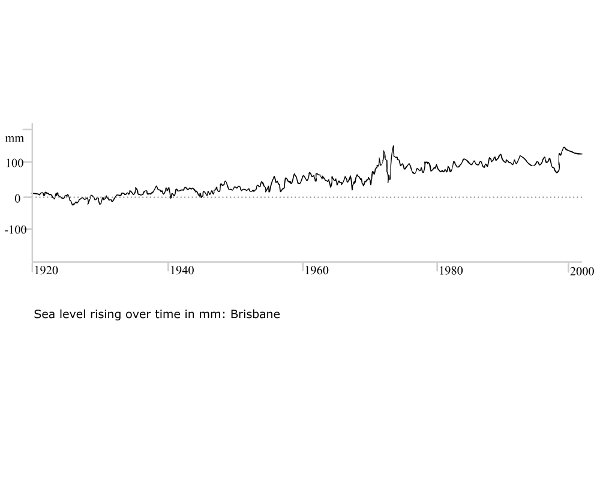
A data set of sea levels rising appears above a dying krill. This refers to the reality that increasing ocean acidity is endangering krill and many other life forms in the sea.
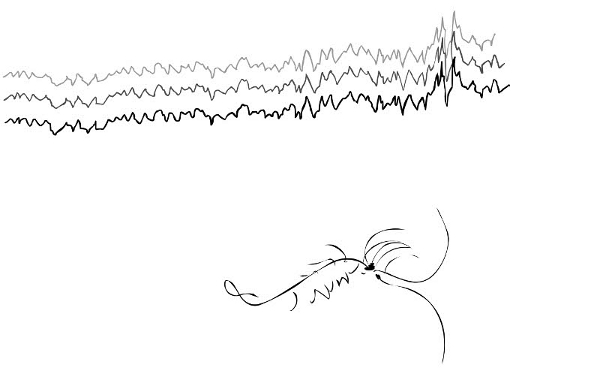
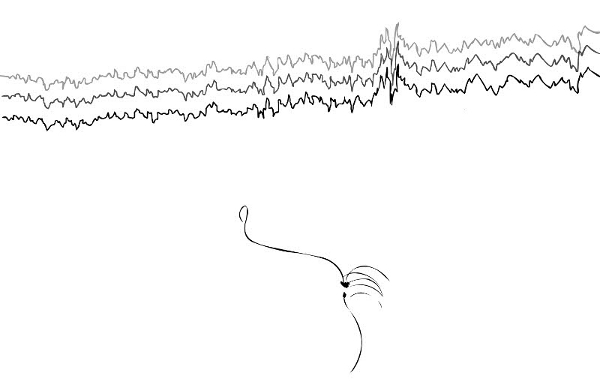
Lisa Roberts, Energies: Sea levels are rising, Digital animation (2008)
A human form unravels the spiral that had formed itself earlier (the symbol of connectivity). The unraveling of a spiral and an inward spiraling gesture signify inner tensions and deep concerns. The inward spiraling gesture also refers to a potential loss of energy that could result from the disruption of regular cycles of sea ice formation.
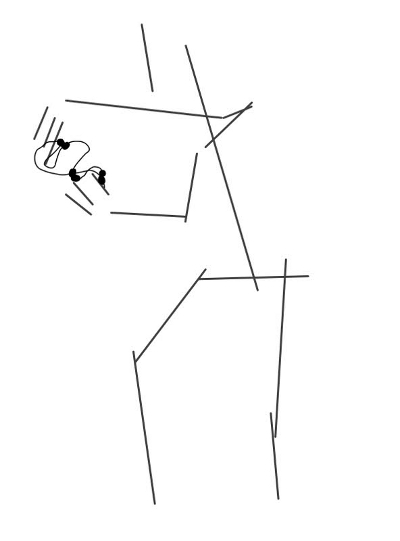
Lisa Roberts, Energies: Wind gathering, Digital animation (2008)
The sound of the icebreaker, RSV Aurora Australis, introduces the final scenes. The sudden appearance of a man-made structure shatters the illusion of Antarctica as pristine.
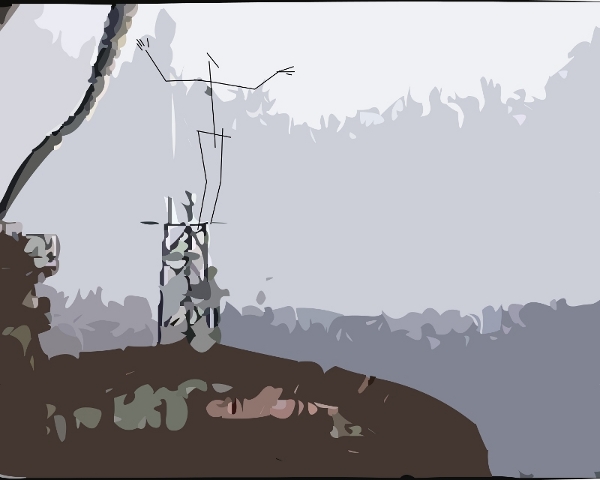
Lisa Roberts, Energies: Finale, Digital animation (2008)
The depth and strength of the ship's horn represents the collective energy consumed by humans. The flow of energy between humans, seals, sea butterflies and water molecules is suggested by a mirroring dance. A sea butterfy (pteropod) appears beside a human form as it falls from the ship to the sea.


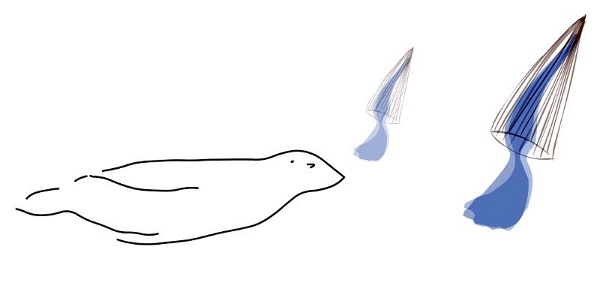
Lisa Roberts, Energies: Finale, Digital animation (2008)
Human scale contantly shifts. Expanding water molecules are followed by data sets that show the effects of oceans warming over the past 80 years (John Church et al., CSIRO, Sydney 2007).
Lisa Roberts, Energies: Finale, Digital animation (2008)


